HAKOM TSM Technology – See time series data in a new way.
Data visualization + monitoring with dashboards.
Graphical dashboards are a fantastic tool to display a variety of information about operating conditions generated from time series data in a compressed form. Different views of databases can be generated compressed in a single window. Visually and intuitively, data becomes understandable, anomalies, correlations and more can be detected. Optimal, if you can work productively and actively in these dashboards, e.g. you can set alerts that trigger actions such as pagers or SMS notifications and the data views are also kept synchronized.
New: Grafana Connector for HAKOM TSM Technology!
With the new Grafana Connector for the HAKOM Time Series Technology, a new world of open source dashboarding is made available to the user. Intuitively and without writing a single line of code, impressive dashboards can be created from TSM data in a few minutes. Especially interesting for users of HAKOM TSM Technology, as they often access data from distributed sources and scales.
Dashboards can be used for pure monitoring or for basic analysis of time series data. The Grafana Connector thus closes the gap between HAKOM TSM Technology and TSM Visuals, the complex visual data analysis by HAKOM Solutions.
Grafana Dashboards – consolidate concentrated information with impressive ease.
Grafana impresses with its powerful range of functions on the one hand and its easy usability on the other. Without any previous knowledge, meaningful dashboards can be generated in the shortest possible time, which also trigger actions if necessary. Currently, about 200 plug-ins ensure high connectivity. Grafana can be used as a cloud solution or embedded in a development environment without licensing.
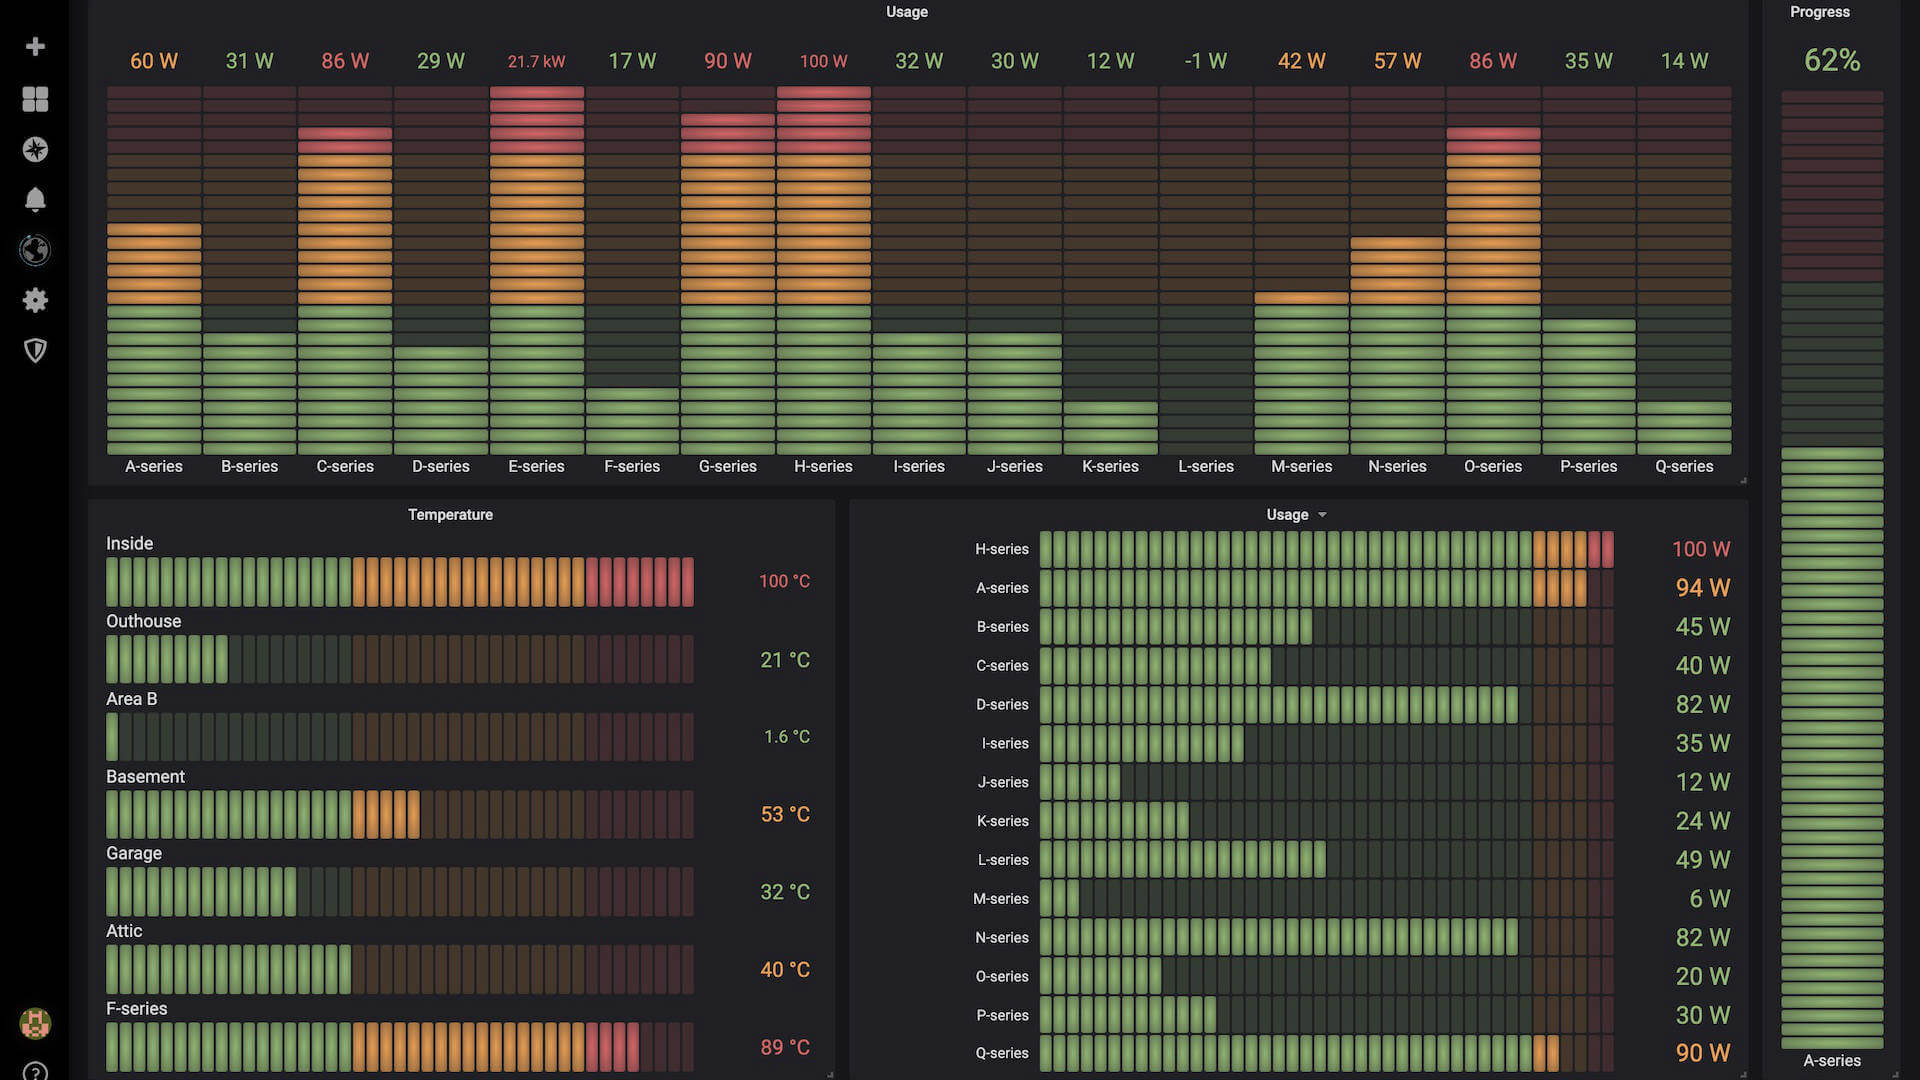
In monitoring, Grafana is particularly convincing with bar gauge gradients, whose thresholds can be edited directly in the dashboard. In real time, peaks can be defined in the dashboard that trigger pager notifications, for example. The type of visualization also reflects all necessities: From classic heat maps to Bar Gauge Retro renderings, everything is possible. The visualization of data on geomaps including real time view from webcams, and all this synchronously, can be realized without having to write a line of code.
The perfect match: Grafana and FeasyUse®!
FeasyUse® is the innovative solution within the HAKOM TSM Technology. It brings together distributed time series data reliably, regardless of the source and scaling, and makes it available for systems that can be scaled as required. With the new Grafana Connector for HAKOM TSM, this data can be compressed and shared in dashboards in work teams or across organizations.
Grafana is the visual counterpart to FeasyUse®. What FeasyUse® does technically, Grafana can do visually. Seldom do two solutions complement each other so perfectly, and all this is now seamlessly connected by the Grafana Connector.
Test and love.
TSM users should test Grafana and be inspired. For those who do not know HAKOM TSM Technology yet, it is a good time to get to know both together for free in the TSM Hosted Lab: E-Mail, Chat or Phone – we are here for you!
Contact the author Thomas Hasleder.


